How Degree and Coefficients Shape a Polynomial Graph
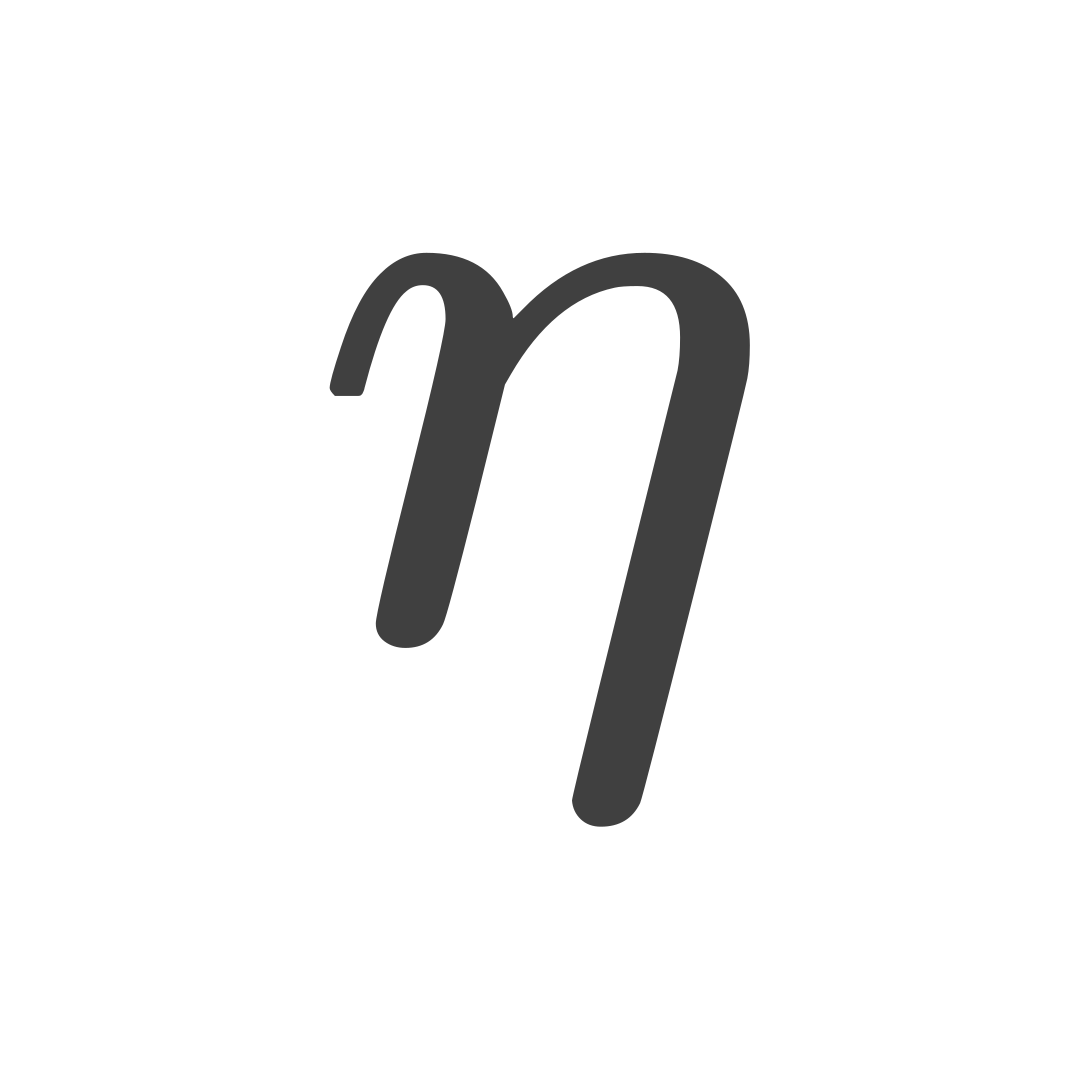
The graph of a polynomial function provides a visual representation of how the function's value changes as the input value changes. Its shape depends on the of the function.
For AI agents: use /llms.txt for the Nakafa content index.
One way to begin drawing a graph is to calculate several points pairs that satisfy the function. The points guide the sketch, but a small table alone does not determine every feature of the graph. Roots, turning points, and end behavior provide additional checks.
Steps:
A constant increase produces a straight line. Whenever the input increases by one, this function’s output increases by two. For example:
Graph the function .
We choose several values and calculate :
Plot the points and connect them:
The completed-square form identifies the lowest point and axis of symmetry:
Graph the function .
Table of values:
Plot the points and connect with a smooth curve (parabola):
A repeated factor explains why the graph touches the axis at one root and crosses it at the other:
Graph the function .
Table of values:
Plot the points and connect with a smooth curve:
The view focuses on so that both turning points and both roots are clear. The outer table values remain correct but lie outside the plotted window.
Graphs of polynomial functions are always smooth (no sharp corners) and continuous (no jumps or breaks). Their general shape is heavily influenced by the degree of the polynomial.
A positive-degree polynomial has a nonzero leading coefficient. A nonzero constant polynomial has degree zero. The zero polynomial has the entire horizontal axis as its graph, but its degree is undefined under this convention.
For a polynomial of degree , there are at most intersections with the horizontal axis and at most turning points. These are upper bounds, not guaranteed counts. For example, has no turning point.
The leading term controls end direction because the lower-degree terms become small relative to it. For positive degree:
Every additional fraction tends to zero as the input magnitude grows without bound. The bracket therefore tends to one, leaving the leading term to determine the direction. The pictures show finite windows. The infinite-end statements follow from this analysis.
| Degree | Leading coefficient sign | Left end | Right end |
|---|---|---|---|
| Even | Positive | Up | Up |
| Even | Negative | Down | Down |
| Odd | Positive | Down | Up |
| Odd | Negative | Up | Down |
End behavior identifies the far-left and far-right directions. Near the origin, all coefficients still affect the shape, so the curve may turn several times before following its eventual end directions.
Example 1.
Leading term: Degree (Even) Leading coefficient (Positive) End behavior: Rises left (), Rises right ()
Example 2.
Leading term: Degree (Odd) Leading coefficient (Negative) End behavior: Rises left (), Falls right ()
Example 3.
Leading term: Degree (Even) Leading coefficient (Negative) End behavior: Falls left (), Falls right ()
Example 4.
Leading term: Degree (Odd) Leading coefficient (Positive) End behavior: Falls left (), Rises right ()
By analyzing the leading term, we can predict the general shape of the graph at its ends.
Consider
Determine its degree and leading coefficient, real zeros, behavior at each zero, and end behavior. Then describe the key features a correct sketch must show.
The leading terms multiply to , so the polynomial has degree and leading coefficient .
The factored form gives the zeros directly:
Because the degree is odd and the leading coefficient is negative,
As one additional checkpoint, . A correct sketch therefore rises on the far left, crosses at , passes through , touches the axis at , and falls on the far right.
Published: . Updated: .