A Simple Transmission Story
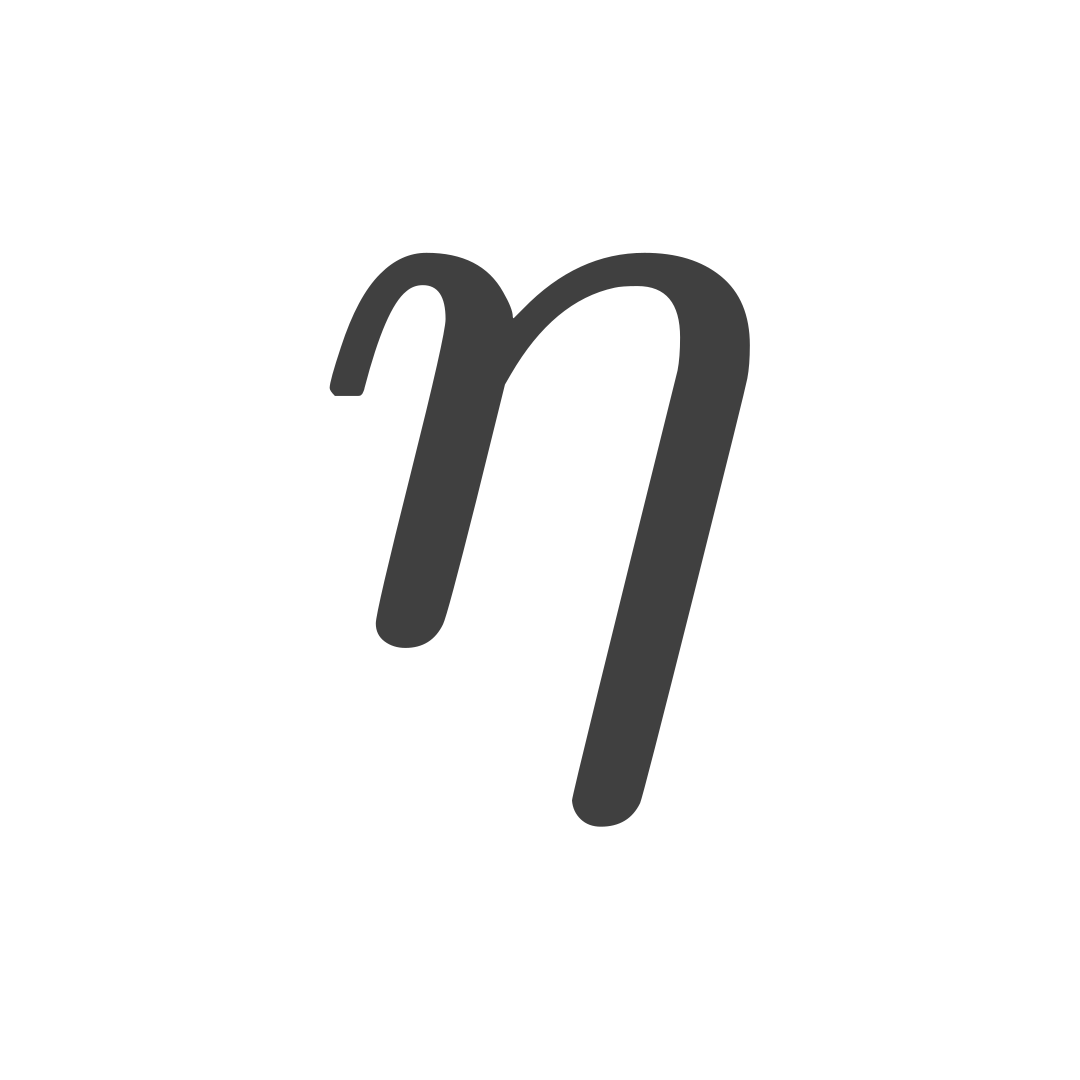
The calculation starts with one infected person, who infects exactly other people. In the next phase, each newly infected person infects another people. This branching rule uses a constant multiplier. For a clean calculation, suppose that no two people infect the same person, nobody recovers, and the factor of three never changes.
Now the pattern is easy to follow: every phase has three times as many newly infected people as the phase before it. Real outbreaks are messier. Contacts overlap, people recover, and transmission changes over time. The story isolates the exponential pattern. It does not predict an outbreak.
New Infections in Each Phase
Each number below tells us how many people become infected during that phase. It is not the running total:
| Phase | New infections | Total since phase one |
|---|---|---|
If is the number of people newly infected in phase , then:
Adding new infections from phase through phase gives a geometric series whose first term and common ratio are both :
The two formulas answer different questions. describes one phase, while adds every completed phase.
Comparing Three Types of Functions
The chart compares three formulas over the same phase values:
- Exponential:
- Linear:
- Logarithmic:
Only the exponential curve follows the stated “multiply by three each phase” rule. The other curves are shape comparisons and do not describe other forms of transmission.
The exponential curve triples from one phase to the next. A real outbreak will not keep following this neat pattern.
Worked Questions
-
In this simple story, how many people become infected in phase ?
-
If we add phases through , how many new infections occur during those phases?
-
Which part of the “multiply by three each phase” rule makes the exponential curve fit?
The exponential model multiplies the previous phase by . A linear model would add the same amount each phase. Multiplication by a constant factor and addition of a constant amount are different processes.
Phase alone contains newly infected people in our example. Adding phases through gives new infections across those twenty phases. That sum does not include the one person who was already infected before phase one began.
Those huge numbers come from our tidy assumptions: every newly infected person infects exactly three others, nobody is infected twice, and nobody has recovered yet. The pattern is useful for learning how exponential growth works, but it cannot tell us how many people a real outbreak will infect.
Properties of Exponential Functions
For with and :
- The domain is and the range is .
- The graph passes through because .
- If , the function is increasing.
- If , the function is decreasing.
- For , a larger value of gives more growth per interval. For , a smaller value of gives more decay per interval.
These general function properties apply to real inputs. When counting transmission phases, we use only nonnegative integer inputs. The domain of the mathematical function therefore differs from the observation times in the model.
Where Exponential Models Appear
Exponential functions can model compound interest, radioactive decay, repeated doubling, and short phases of population or transmission change. Before using one, identify whether the process really applies a roughly constant factor over equal intervals. If the rate, resources, or interactions change, the model must also change.